Brief Analysis on Police Shooting Record in the US from 2015 to 2019
Are all Victims Guilty?
Police shootings are not a rare thing in people’s daily life. Though it happens a lot, news of police shootings can still attract citizens’ attention. Sometimes people do not believe all shootings should happen and they think some people are innocent. The Washington Post has identified the FBI and CDC’s acknowledgments of under-reporting and they believed that there are much more shooting cases that are still not reported by the police. They have gathered additional data from “local news reports, law enforcement websites and social media, and by monitoring independent databases such as Killed by Police and Fatal Encounters’’. By doing so they have documented more than twice as many fatal shootings by police as recorded on average annually.
We are interested in the reason why these people were shot. There could be a lot of reasons and with the analysis of different factors, we hope to find some relationship between shooting and other factors. Some factors of victims cannot be changed by them like gender, age, and races. And also, some factors of the environment or things that people can choose not to do like holding guns, poverty rate of the county and median income of the county. With the relationship among these factors and shootings, we can give some strategies for the innocent citizens to help them not be shot by police.
Are There Specific Characteristics of Victims themselves?
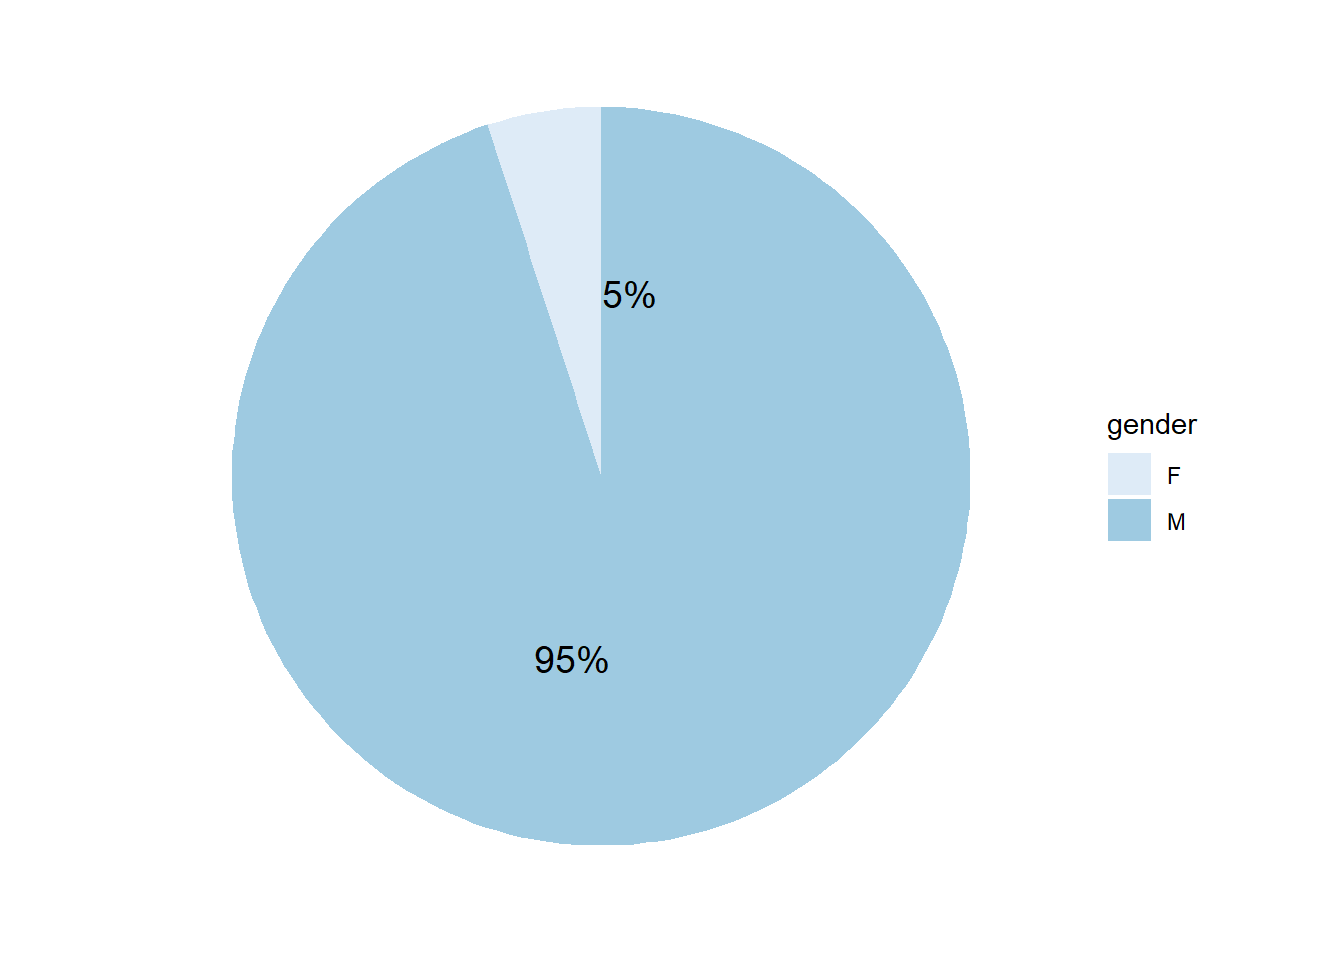
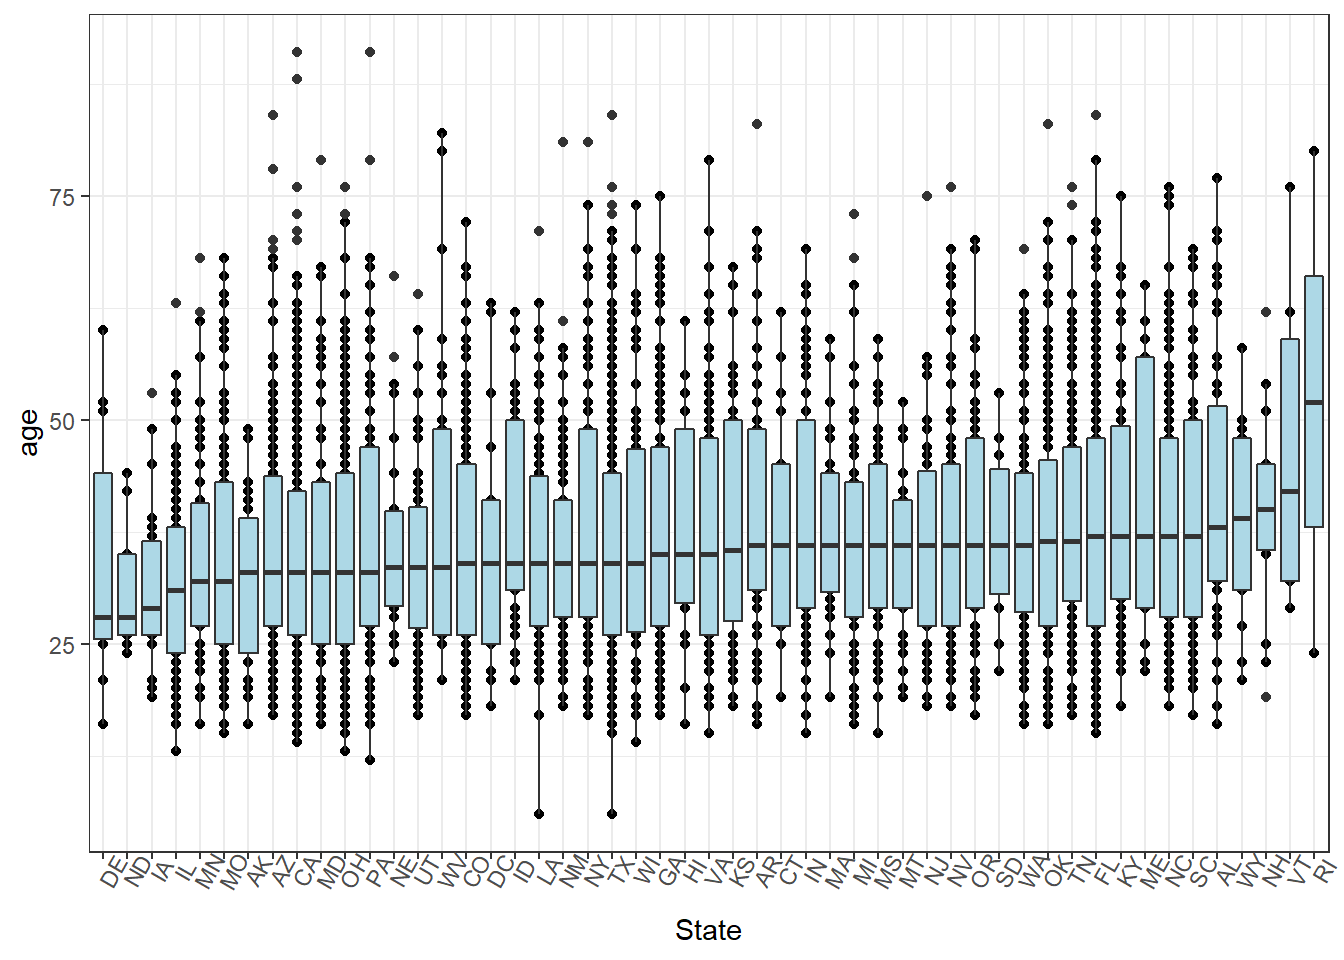
We start our research by trying to find the difference between the inner factors of these victims and all citizens in the US. The data shows that the mean age of victims are located from 25 to 40 in most states which implies that police believe people around these ages have a higher probability than other ages to commit serious crime which lets them be shot. Also, among all victims males occupy 95% which is much higher than females. And this finding helps us know when police are deciding whether to shoot or not, male have a much higher chance of being shot.
Race is also one of the factors that we are interested in but the data didn’t show an essential difference in races. The proportion of different races in victims are similar to the proportion of the citizens in the US, which is reasonable to our intuition.
Are There Any Factors from the Environment Affecting the Choice of Police?
After doing the analysis on inner factors, we then focus on the outer factors which we think are more important since inner factors can not be changed but outer factors we have a chance to change which means can lower the probability of being shot. These factors include poverty rate of the county, holding guns or not, median household income of the county and trying to flee or not, etc.
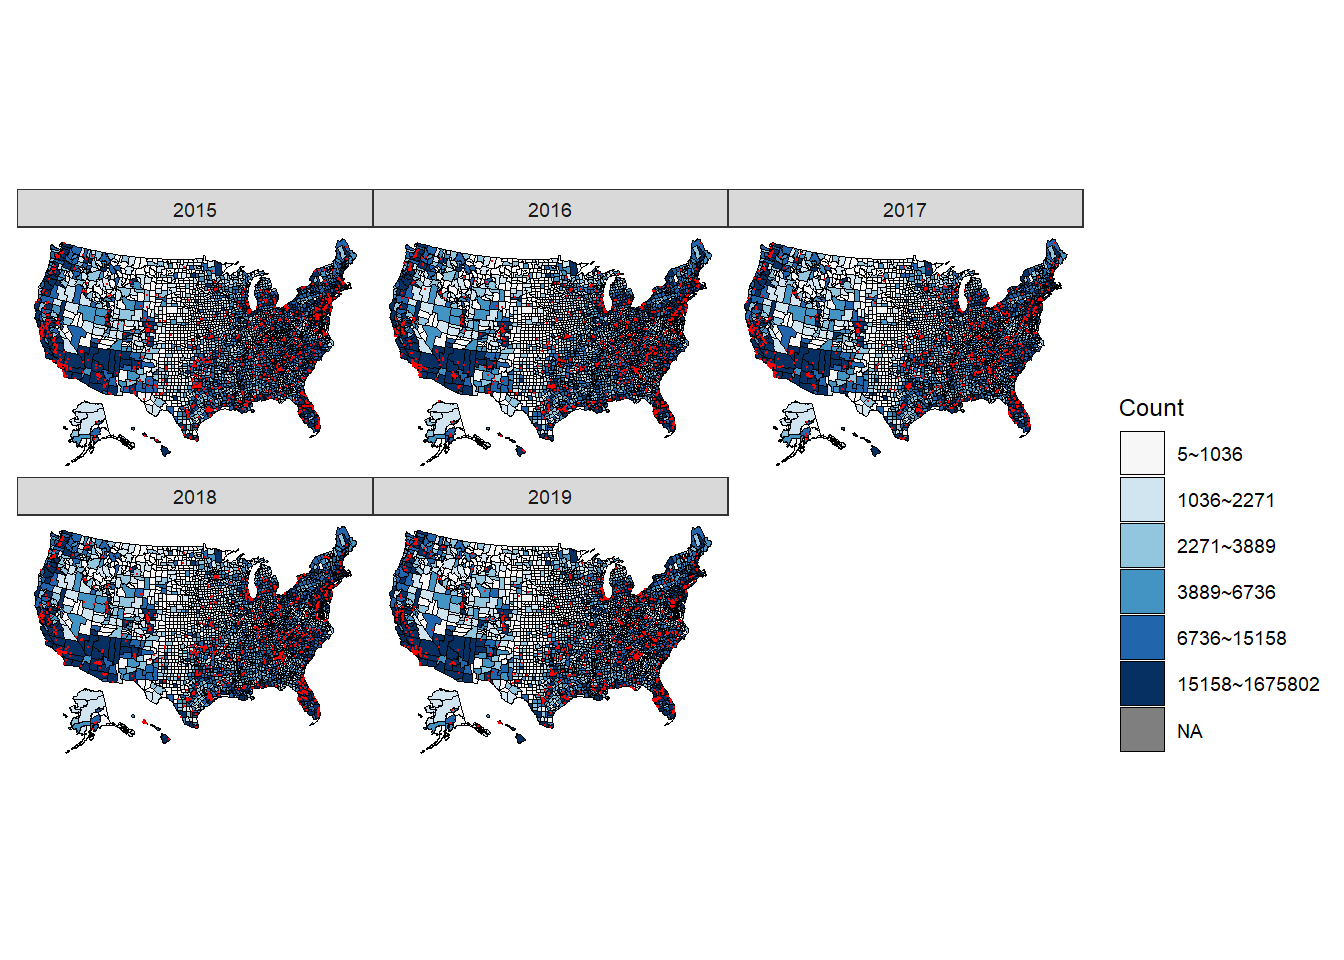
We made an interactive page which shows the graphs of poverty rate and location of each shootings of different years and with these graphs we can have a clear and direct view of the relationship between poverty rate and shootings. We find that police shootings happen more at the place with higher density of poverty counts but not higher poverty rate, which implies that the place with high density of population can have more police shootings and location is an important factor. More specifically, the shootings are mostly clustered around California, Washington, central and northern Texas, Florida, east northern coast (MA and NY). Furthermore, we find that the places with high poverty counts usually have relatively low median household income like Texas and NewYork.
Why Hold the Gun?
Moreover, in the analysis of outer factors, we find that holding a gun or not is a really important factor. The proportion of victims holding a gun is more than 60% which is much higher than the rate of holding a gun in the US (around 30%). In this situation, holding a gun can be considered as a important factors of being shot by police an540d to have a deeper understanding, we decide to make model base on this factor to see if holding a gun or not is also affected by other factors like will place with high poverty counts affect victims to decide hold a gun or not. We want to know why these victims decide to hold a gun.
After meeting some challenges, we finally see the percent change each regressor would have on the probability that the suspect carries a gun:
- For every increase in year of age, the suspect is 1.644% more likely to carry a gun.
- For every increase in the percent of the county’s people living in poverty, the suspect is 4.37% less likely to carry a gun.
- For every thousand dollar increase in the region’s median household income, the suspect is 1.2% less likely to carry a gun.
- For every increase in the percent of the state’s people owning a gun, the suspect is 477% less likely to carry a gun.
- If the suspect is a male, he is about 61% more likely to carry a gun.
- If the suspect is fleeing on foot or not fleeing, or other types of fleeing, they are 131%, 37%, and 296% more likely to carry a gun.
- If the suspect is white, the suspect’s 2% less likely to carry a gun.
- If the police are wearing a body camera, the suspect is 20% less likely to carry a gun.
- If the suspect shows a sign of mental illness, the suspect is 31.8% less likely to carry a gun.
Some of the coefficients seem reasonable but some other coefficients seem to have too huge effects to be accurate. For instance, it is almost five times more likely that the suspect would carry a gun if the percentage of population owning a gun within a state increases by 1%. Hence, we performed a variable selection on what exactly contributes the most in explaining the suspects’ owning a gun.
We than tried AIC selection method. After selection, the only variable removed is whether the suspect is white or not. The remaining predictors’ coefficients did not change much, either. Hence, this suggests that race is not necessarily a dependable indicator to whether or not the suspect would carry a gun. Nevertheless, the problem of some predictors having significantly higher effects than expected remains unsolved.
Strategies for Innocents
From the research, we find there are several important characteristics of victims. People with these properties should communicate with more patience and kindness.Firstly, 95% victims are male in between 25 and 40 years old which implies that these group of people are considered as a high threat level by police. Secondly, people who live in city with lots of poverty people (Counts not Rate) should be more careful. In these places, police will be more likely to shoot to eliminate the potential risk than the police of a place with less people. Thirdly, people with guns should be really careful since holding a gun is a really important feature of victims in the data set. Moreover, from the data set, we don’t see any discrimination of different races and the things can help innocents are being nice and patience to let the police not consider you as a threat.
Extra Statement
We know our topic is really sensitive and may offend some people but we really don’t mean it. What we want to do is honestly reflect the findings of the dataset and to help people have a further understanding on the different characteristics of victims. Moreover, we don’t mean or say that there definitely are innocents and we just want to provide some suggestions for people who may be in the situation and help them communicate better with police to eliminate unnecessary conflict.